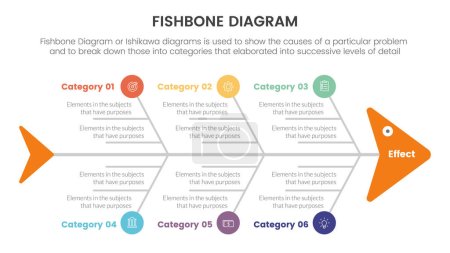
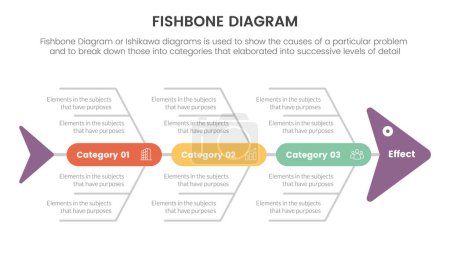
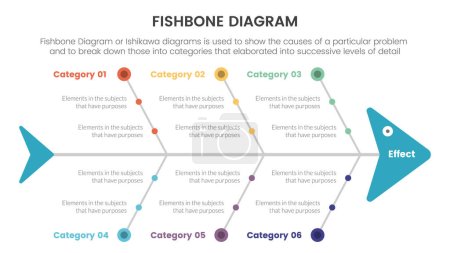
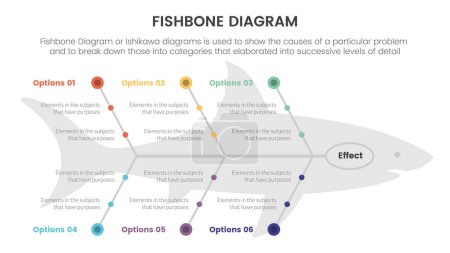
48 Vektoren zum Thema "fish bone diagram" bei ClipDealer

Medien sortieren nach     Gehe zu Seite:    
« Vorherige  1  Nächste »
Fishbone diagram for analyse
Fish skeleton vector pictogram
CAUSE EFFECT DIAGRAM CONCEPT
Fishbone Diagram Cause and Effect Template
Fishbone diagram tool to analyze cause of problem, root cause analysis or finding solution to solve problem, analyze effect or impact concept, businessman drawing fishbone diagram to analyze problem.
Fish bone vector icon
Fish skeleton vector icon
illustration of a fish
black fish skeleton fishbone with text isolated on white simple vector
Salmon cuts diagram - whole fish, pan dressed, fillets and steaks
Fishbone icon. Trendy Fishbone logo concept on white background from museum collection. Suitable for use on web apps, mobile apps and print media.
Salmon cuts diagram - whole fish, pan dressed, fillets and steaks
Fishbone infographic design collection with colorful text slot. Infographic design on white background, Stylish Infographic elements for business presentation concept.
Fish Characteristics infographic diagram including slippery scales gills laying eggs cold blooded fins tail living in water swim bladder and lateral line for biology science education
fishbone diagram fish shaped infographic with big circle and icon concept for slide presentation vector
Fishbone chart diagram infographic. Business concept vector illustration
fishbone diagram fish shaped infographic with round shape box point on center concept for slide presentation vector
fish diagram
fishbone diagram fish shaped infographic with small circle dot connection information concept for slide presentation vector
fishbone diagram fish shaped infographic with small circle dot connection information with fish shape background concept for slide presentation vector
Vitamin D infographic
Fishbone diagram Ishikawa methodology infographic with measurements, materials, personnel, environment, methods, machines. Colored scheme of cause and effect method for managers.
Chief hat, cooking pan icons.
The vector featured a fish skeleton or fishbone for a presentation and illustration. The fish has 6 parts of editable text to analyze the cause of effects or problems in the company or production.
Chief hat, cooking pan icons.
The vector featured a fish skeleton or fishbone for a presentation and illustration. The fish has 6 parts of editable text to analyze the cause of effects or problems in the company or production.
Functions of vitamin D in human body and immune system sources in food outline diagram. Labeled educational scheme with health benefits from eating ingredients and sun light vector illustration.
Matching game for children, animals and favorite food
Chief hat, cooking pan icons.
Steak infographic concept, flat style
Matching game for children, animals and favorite food
Soil Layers with dinosaur fossil
Pyramid chart template.
Fish bone Infographic chart business to present data, progress, direction, infographic that outlines the steps of the management process. vector illustration.
The vector featured a fish skeleton. A template is a tool to analyze and brainstorm the root causes of an effect and solution. A fishbone diagram presentation is a cause-and-effect Ishikawa diagram.
fish bones icon animals food, spine line and flat icons set, editable stroke isolated on white, linear vector outline illustration, symbol logo design style
Fishbone diagram Ishikawa methodology infographic with measurements, materials, personnel, environment, methods, machines. Colored scheme of cause and effect method for managers.
fish bones icon animals food, spine line and flat icons set, editable stroke isolated on white, linear vector outline illustration, symbol logo design style
Fishbone Diagram Cause and Effect Template for business Timeline infographics. vector design.
fish bones icon animals food, spine line and flat icons set, editable stroke isolated on white, linear vector outline illustration, symbol logo design style
Technical Problem Root Cause infographic. A fishbone or cause and effect or Ishikawa diagram is a  brainstorming tool to analyze the root causes of an effect. Fish skeleton template for presentation.
Fish bone Infographic chart business to present data, progress, direction, infographic that outlines the steps of the management process. vector illustration.
fish bones icon animals food, spine line and flat icons set, editable stroke isolated on white, linear vector outline illustration, symbol logo design style
Infographic Fishbone diagram template design. Suitable for slide presentation
fish bones icon animals food, spine line and flat icons set, editable stroke isolated on white, linear vector outline illustration, symbol logo design style

« Vorherige  1  Nächste »